Imagine being able to see life in some of the most unexplored oceans on earth?
This is the reality for scientists and partners who are part of the Global Ocean Wildlife Analysis Network (GOWAN), a global network of underwater cameras designed to monitor ocean biodiversity and ecosystems found in the vast waters of the UK Overseas Territories (UKOTs). Started in 2020 and open to all UK Overseas Territories (UKOTs), GOWAN builds on the successes of the Blue Belt Programme which has supported the protection, management, and conservation of over 4 million km2 of ocean.
In the first of our two-part blog series, we spoke to Dr Paul Whomersley, International Marine Advisor at Cefas, to learn more about the Global Ocean Wildlife Analysis Network (GOWAN). In this second instalment, Professor Jessica Meeuwig from Blue Abacus and the University of Western Australia, and Kirsty Jones, Marine and Fisheries Conservation Officer for St Helena Government, explain how the data is collected and then used to inform conservation and protection policy.
Can you tell us more about the role of Blue Abacus in the GOWAN network?
Jessica Meeuwig: Blue Abacus is a social enterprise established to support organisations that wish to better understand the status of their marine wildlife using BRUVS. Blue Abacus emerged from nearly two decades of BRUVS-focused research at the University of Western Australia in my lab, including the adaption of BRUVS to the mid-water open ocean environment. As part of GOWAN, Blue Abacus supports the UKOTs by providing BRUVS and training in their use. Additionally, we advise on how specific questions could be address with respect to the sampling plan. For instance, a UKOT may wish to benchmark the status of its open ocean wildlife or evaluate the benefits of a protected area. Both these goals can be addressed with BRUVS but where the BRUVS are deployed will depend on the question of interest.
To date, surveys have been completed in remote UKOTs such as Pitcairn Island and Ascension Island, and in the heart of the Caribbean on Anguilla, Bermuda, Cayman, Montserrat and the Turks and Caicos. Samples are also flowing from the British Antarctic Territory despite the havoc of icebergs dragging off the BRUVS. With typically single surveys completed so far, it is too early to unveil findings. However, the imagery so far captured presents an outstanding opportunity for education and outreach. If we don’t know much about our oceans, it is unlikely we will care for them. And the best bits are when you see that unexpected animal: a Critically Endangered oceanic whitetip shark cruising past the BRUVS in the Cayman Islands, penguins picking up stones from the seabed in Antarctica.
How does the data get analysed?
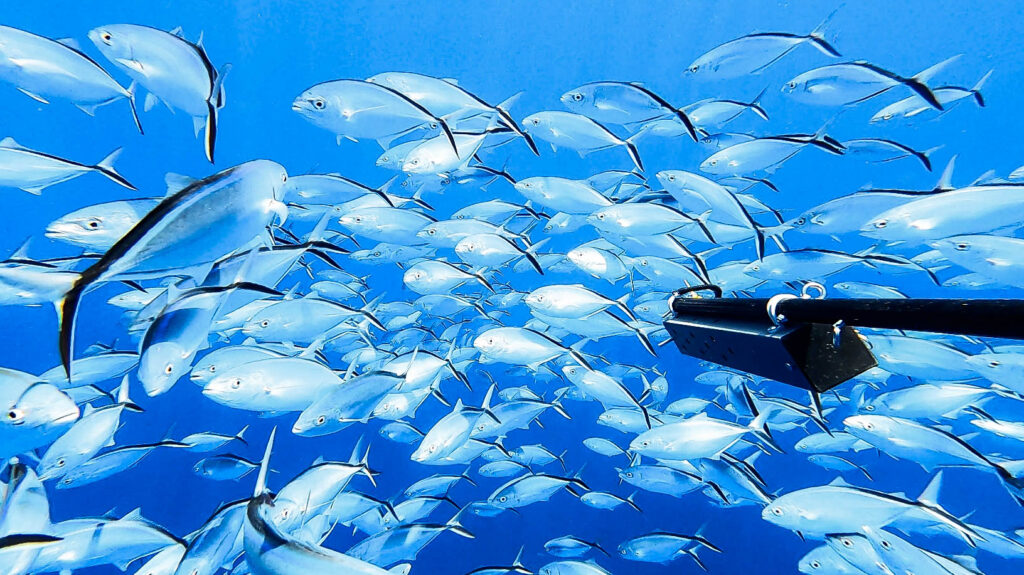
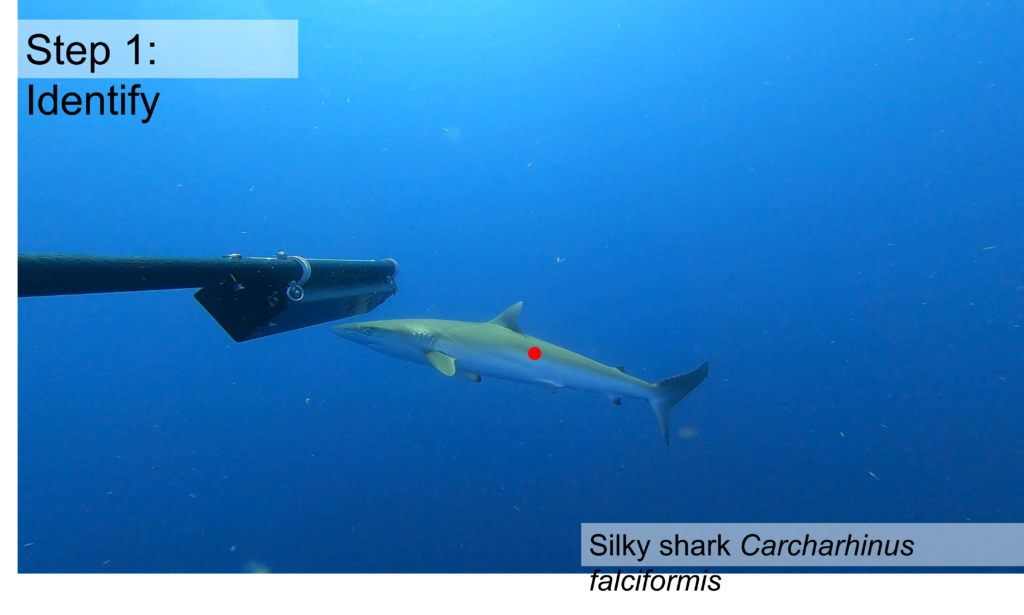
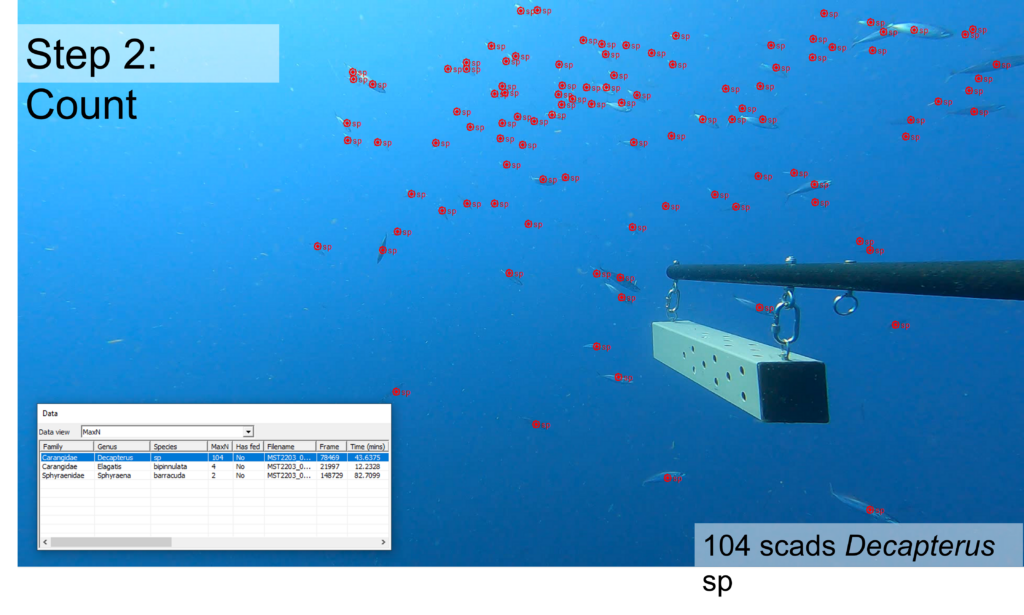
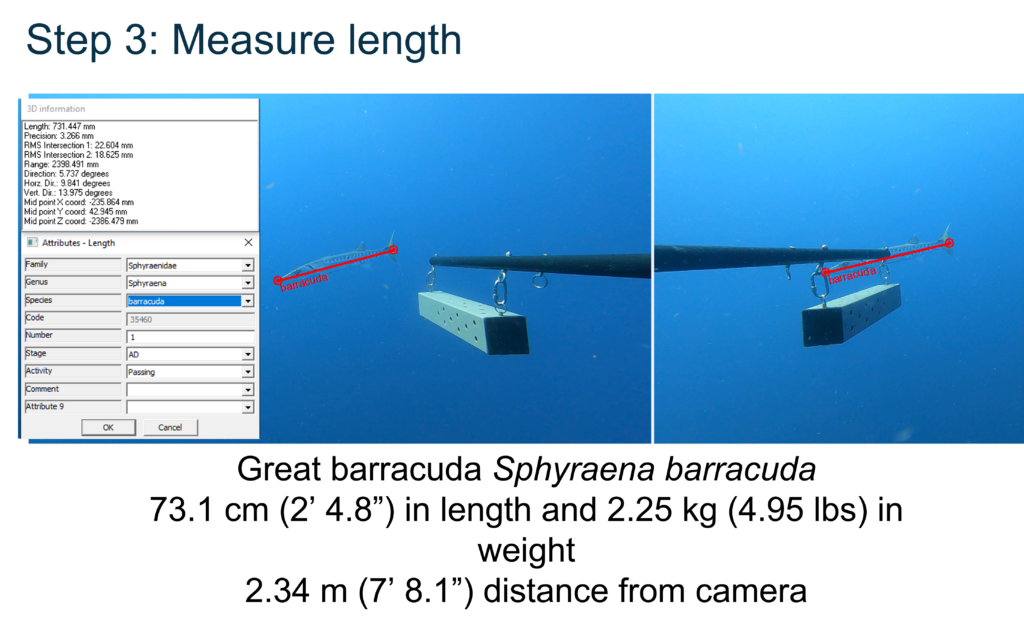
Jessica Meeuwig: The video collected by the UKOT teams in the field provides an excellent educational resource. Most importantly, it is also used to generate hard science: How many species? How many animals of each species? How big are they? How do they vary in space and time? To generate these data, the UKOT sends the raw video from the field to Blue Abacus. Using specialised software, the video is then watched by our team of specialists who first identify each individual animal. We then count the maximum number of them in a single frame, as an estimate of abundance; this prevents multiple counts of individuals that swim in and out of the field view. Finally, using stereo-imagery, we measure the size of animals, from 1 cm drift fishes to > 3m oceanic sharks. (see Figs 1-3)
The amount of time it takes to process the video depends on the size of the survey and the complexity of the fish assemblages. Indeed, coral reefs are the busiest habitats with fewer fish observed in seagrass meadows or in the open ocean. Once all the video is analysed, we then calculate key characteristics of the fish communities such as species richness, total abundance and total biomass. These characteristics, along with information on individual species, can be used to answer the questions identified by the UKOT team and also to compare across UKOTs in the network. The data and a report are then sent back to the UKOT for their consideration.
What are some of the challenges of collecting underwater data?
It is a lot harder to count fish than it is to count trees. Concealed by the ocean’s surface, marine wildlife is found hanging out on the seabed or moving along migration routes. Collecting data on marine wildlife is as challenging as the ocean is vast. For this reason, we need tools that allow us to cost-effectively and efficiently study our marine wildlife.
St Helena is supported by the GOWAN network, how important is data for the management and protection of St Helena’s Marine Protected Area?
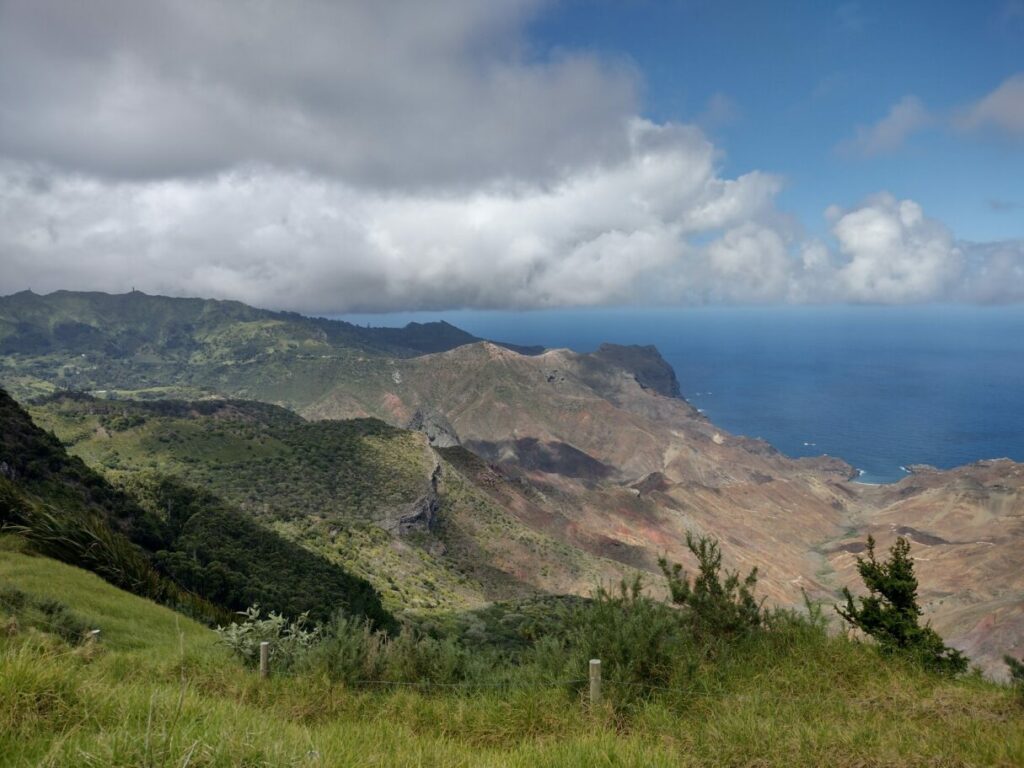
Kirsty Jones: St Helena is an isolated island in the South Atlantic Ocean and lies 930km east of the mid-Atlantic ridge. The island has a 449,411km2 IUCN Category VI Marine Protected Area (MPA) that allows sustainable use of its natural resources. This means that low-level human use, like one-by-one fishing, is permitted if it doesn’t undermine the MPA’s objectives of protecting and conserving the marine environment. Fisheries science therefore forms the largest part of the St Helena Government’s work plan which provides the evidence base for the MPA’s fisheries management. It is very important that the data collected is robust and can be translated into effective management measures. For example, we use data to help inform total allowable catches, minimum landing sizes and fishing quotas.
St Helena is supported by the GOWAN network, how important is data for the management and protection of St Helena’s Marine Protected Area?
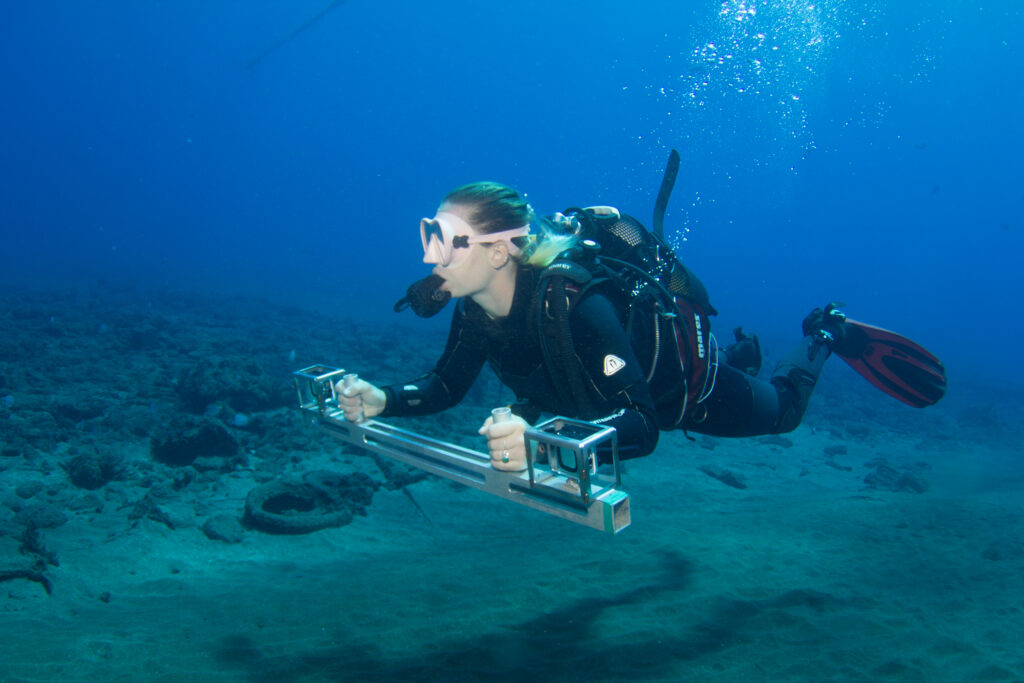
Kirsty Jones: The use of the BRUVS presents an opportunity to fill data gaps and provide additional evidence needed to support the sustainable management of its MPA by collecting data on semi-pelagic species and their associated critical habitats. We have now just completed our first deployment and are excited to see the results from Blue Abacus. The BRUVS will also be utilised for assessing impacts of marine developments like sand extraction, and a study will take place to investigate the benefits of adding BRUVS to St Helena Government’s current underwater visual surveys undertaken on SCUBA. To do this, a handheld version of the BRUVS has been developed and a SCUBA diver will follow the same transect as our current surveys. This could be used as a way to omit human error when assessing species presence, species abundance and habitat type, making the data we collect more robust.
What would you say to other UKOTs looking to join GOWAN and the value of using BRUVS?
Using BRUVS have a plethora of benefits to data collection. They are a multipurpose, simple piece of equipment that can be used over and again to answer many different research questions. We currently use them for one main theme but are already looking into what else we can use them for, like seeing if they can be used alongside our underwater visual surveys. BRUVS are also a really fun and practical way to do research, allowing the data collected to be used for community engagement and outreach purposes – who doesn’t love seeing high quality footage of charismatic marine life!
Leave a comment